Soon after the installation of EveryZ what one notices more easily in Zabbix modification is the addition of a menu and change the logo located in the upper left corner of the site. When you click on the option EveryZ inside menu Extras you are forwarded to the EveryZ dashboard that gives access to the modules.

In your original configuration have three widgets to access modules (links) and three dynamic content widgets (custom DIV).
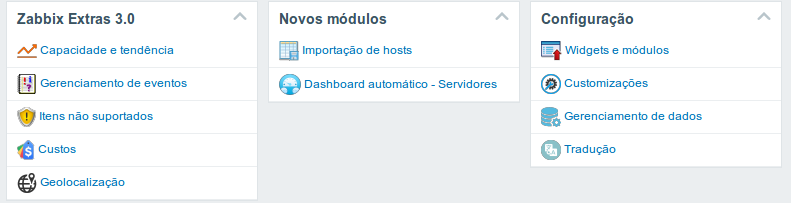
- ZABBIX Extras 3.0
The modules that are part of the Zabbix Extras are accessible from this widget. Zabbix Extras is composed of:
- Capacity and tendency
- Event management
- Items not supported
- Costs
- Geolocation
- New modules
From this widget are accessible modules of illustration of the possibilities of development of new modules.
- Import of Hosts
- Automatic dashboard-servers
- Setting
From this widget control modules are accessible from the EveryZ itself. Actions such as translation, adding new modules, and backup are made through these modules.
- Widgets and modules
- Customizations
- Data management
- Translation
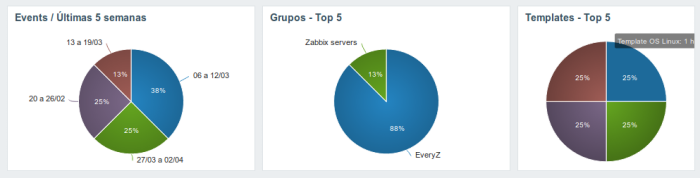
- Summary of events of the last weeks
Dynamic graph in JavaScript (d3.js suite) showing quantitative summary of incidents of the last 5 weeks.
- Top 5-groups
Dynamic graph in JavaScript (d3.js suite) showing the 5 groups with more hosts in the environment.
- Top 5-Templates
Dynamic graph in JavaScript (d3.js suite) showing the 5 templates with more hosts in the environment.
